4.2 Imputation
The evaluation of several imputation strategies led to a straightforward approach: Categorical features had a missing level added during encoding (Section 3.3.2). All other features were imputed by their median value to account for the skewed distributions. The notebook 4_Imputation.ipynb17 contains details on the other approaches studied.
In concordance with the cup documentation’s requirements (Appendix B.1), constant and sparse features were dropped from the data set before imputation. The approach used in the R-package caret was implemented in a scikit-learn transformer for this purpose. Work from a blog post (Goddard 2017) was adapted. The beauty of the method used in caret is that it is data type agnostic. It works on the number of unique values per feature and the frequency ratio between the top and second values by count.
The features with most and least missing values are shown in Figure 4.1. It is not surprising to find the MONTHS_TO_DONATION_* features among those with most missing because few examples respond to the promotions with a donation.
Among the incomplete features with least missing values, there are several of the US census features. The RFA_* features give the status in reference to promotion \(i\). All examples who did donate at some point before have an RFA status. Thus, the missingness indicates when new members were added because newly added members do not have an RFA status yet.
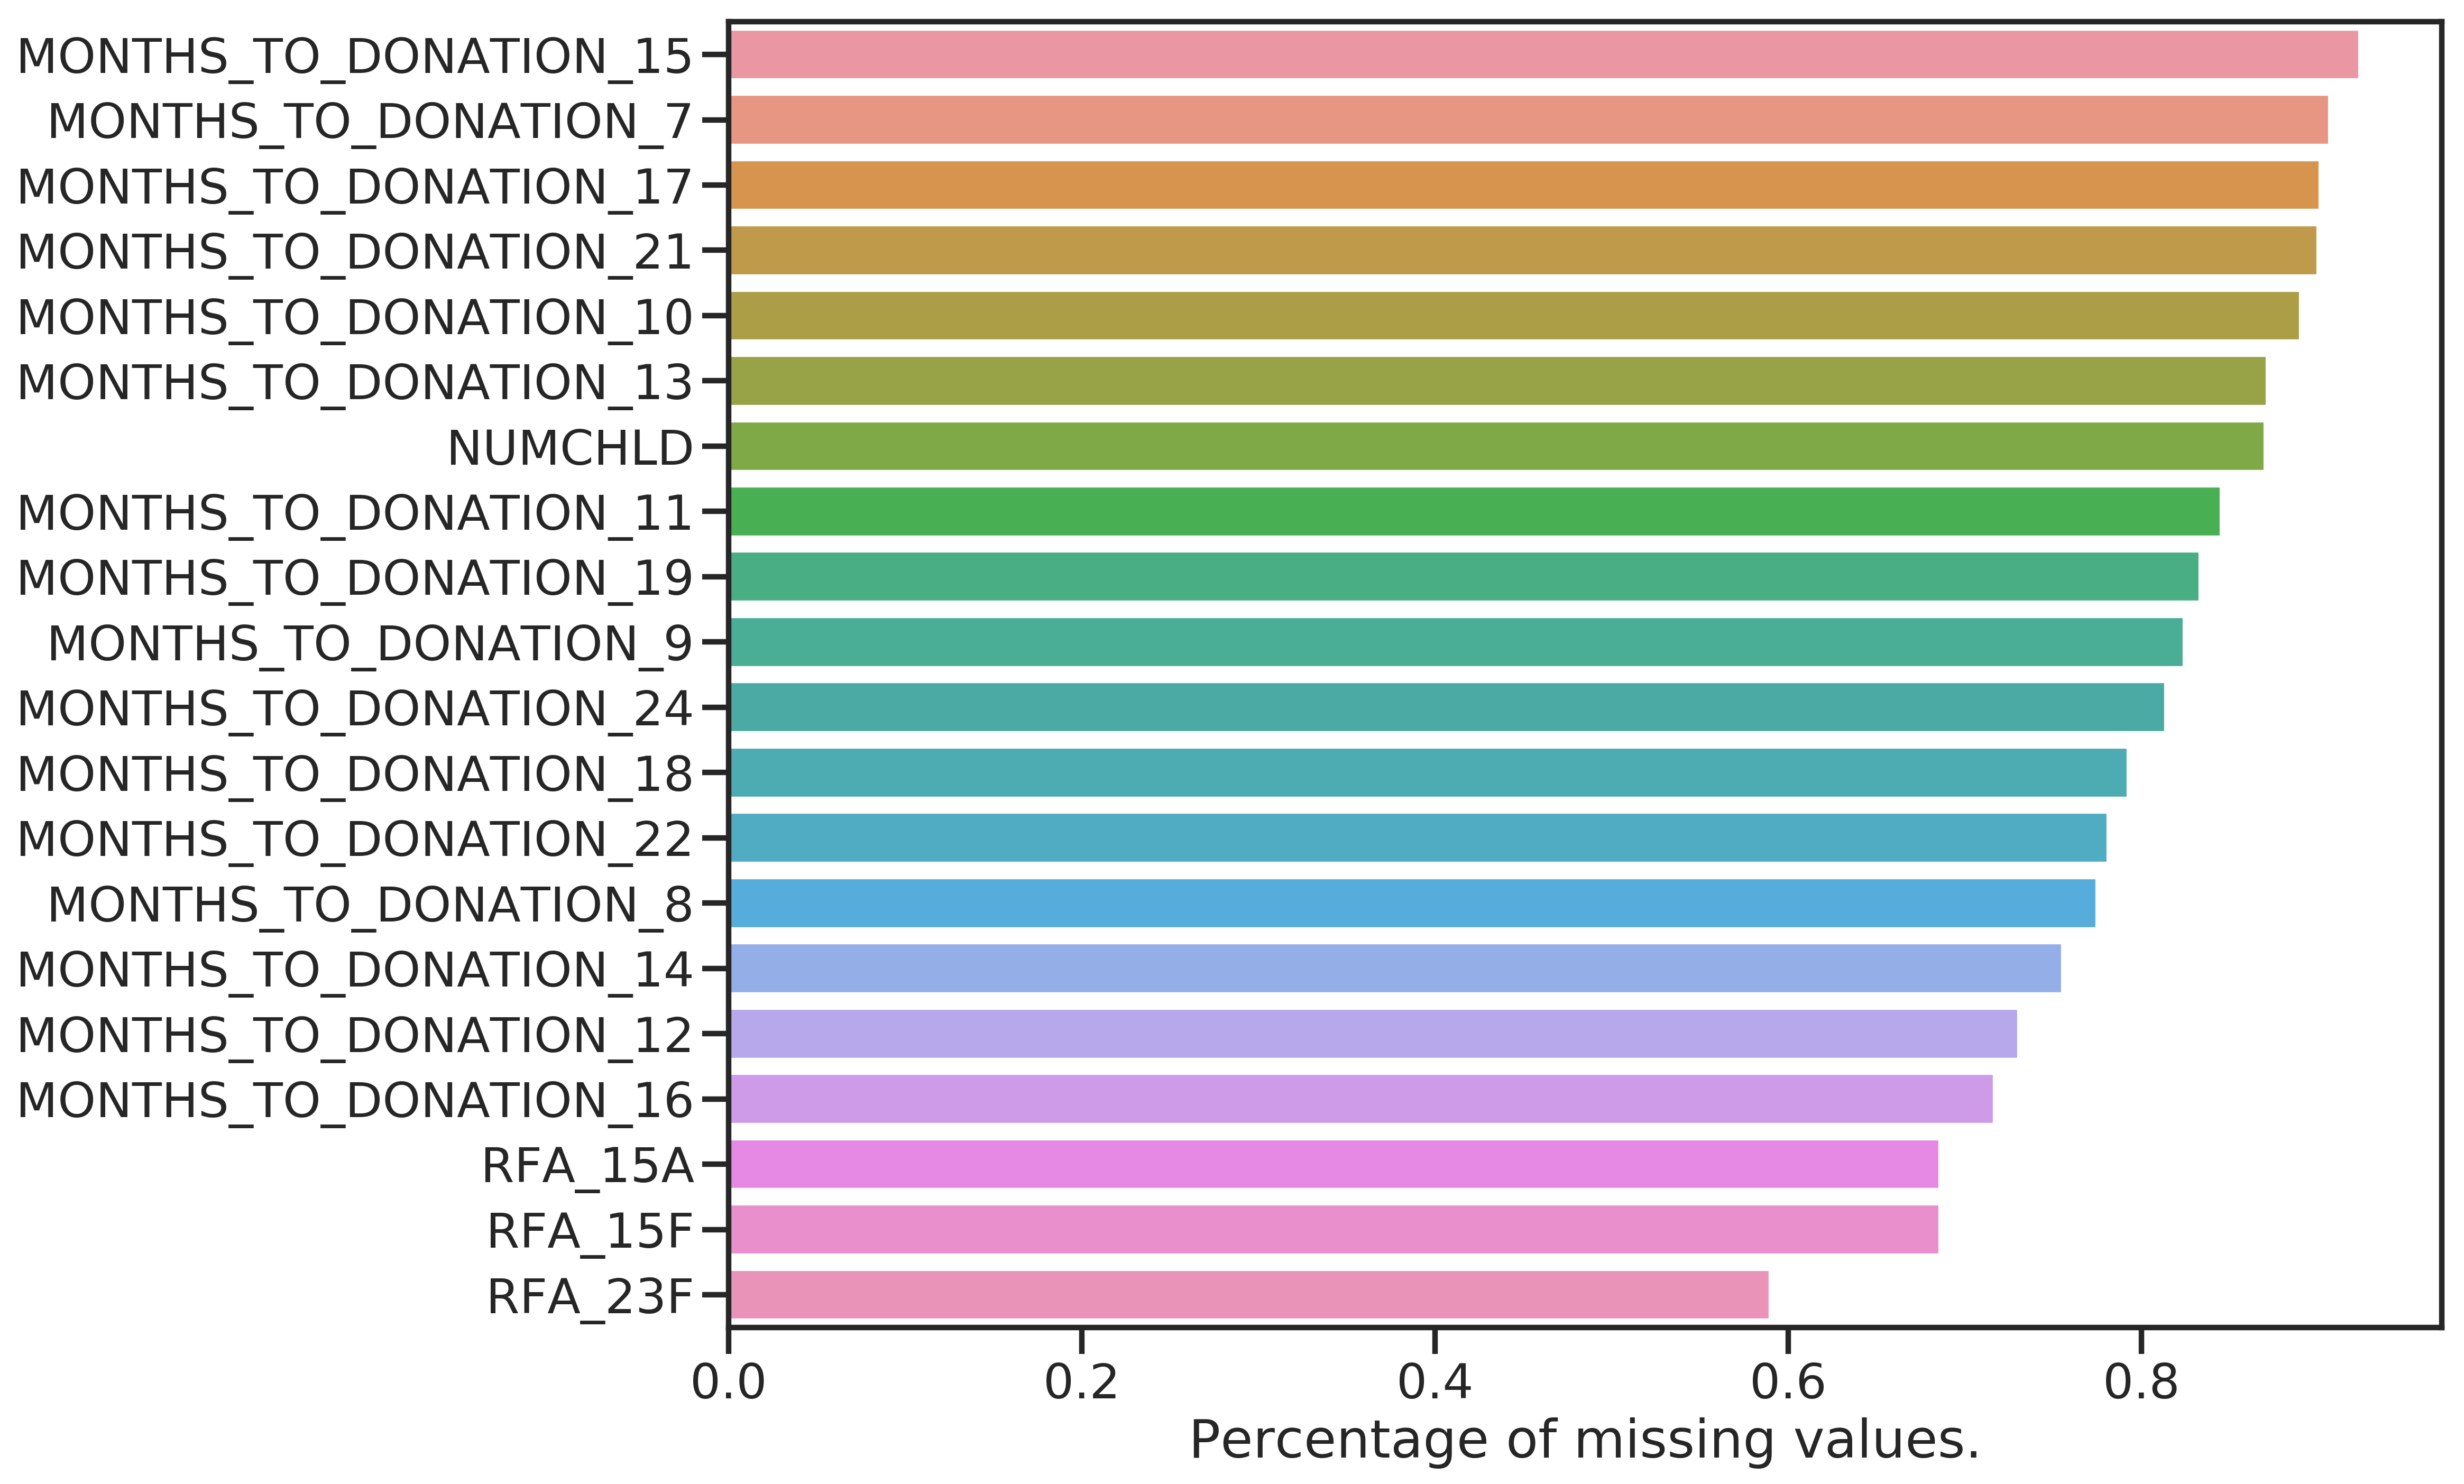
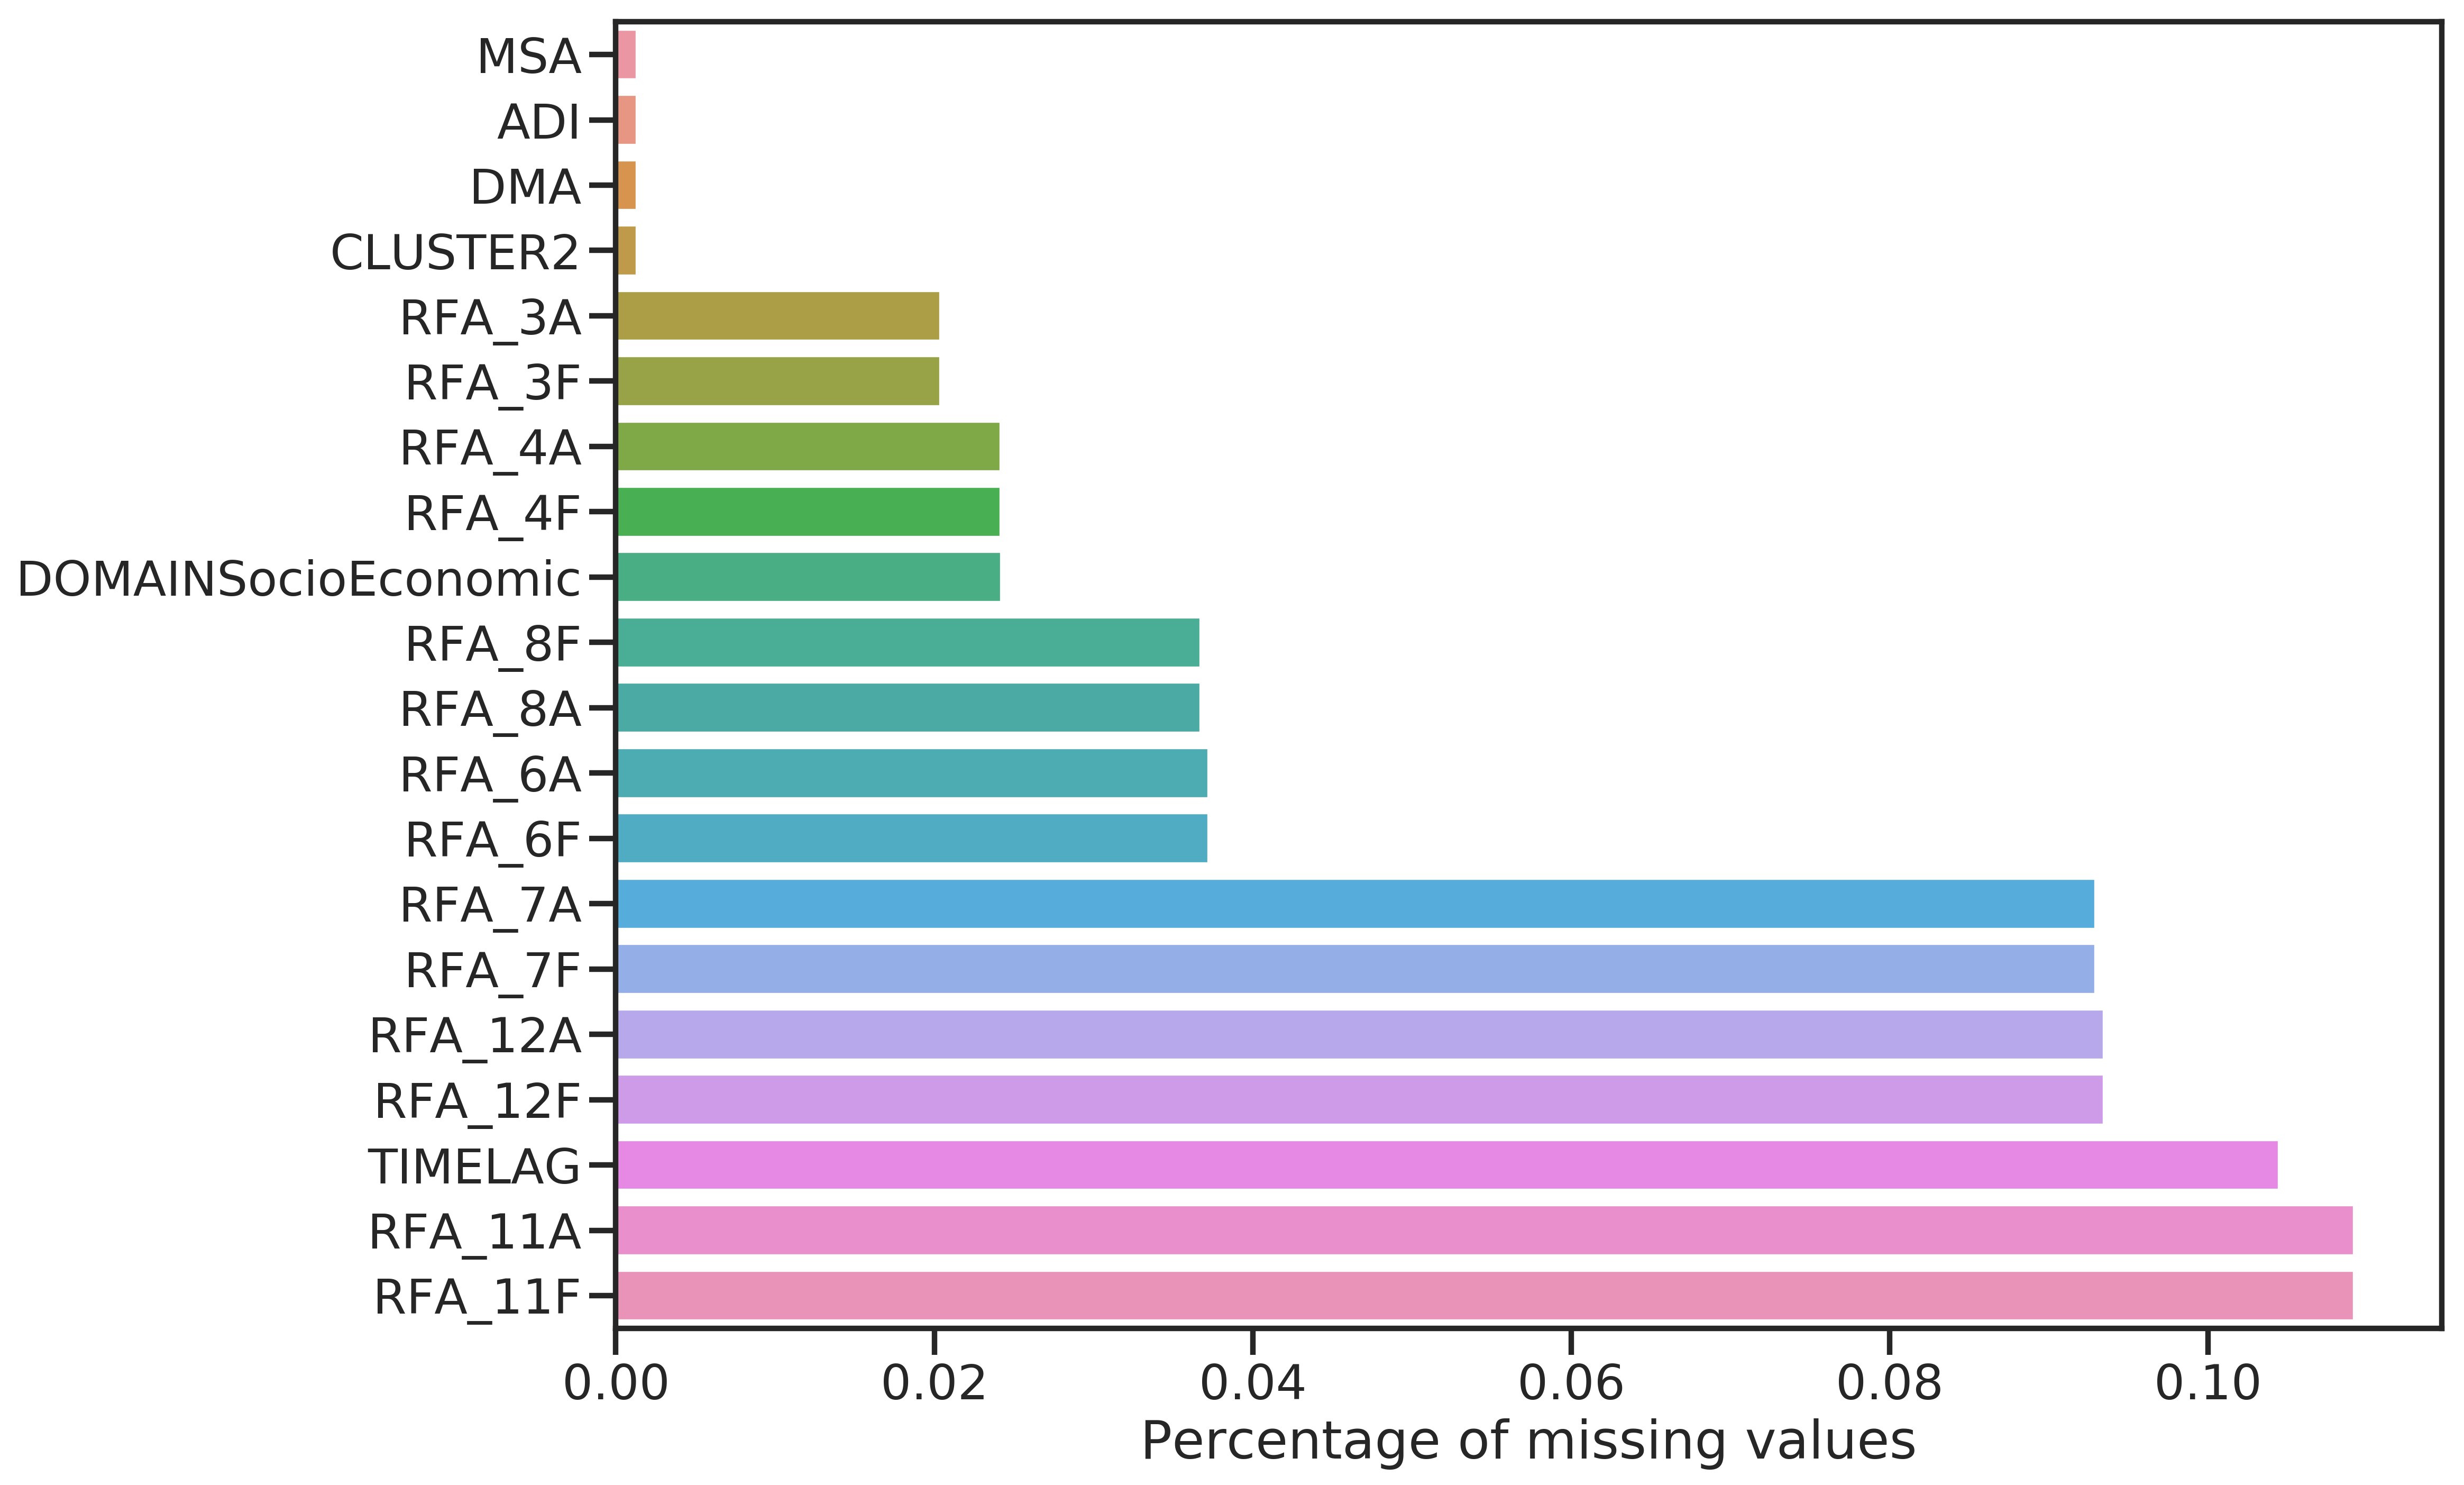
Figure 4.1: Features with most (left) and fewest (right) missing values.